How Many White People Are Killed By Police: Annual Statistics & Data

In the United States, police-related deaths often highlight the impact on minority communities, like Black Americans. But what about white victims of police violence? How do their numbers stack up against other racial groups? Let’s explore the statistics to find out.
Police Shooting Statistics: Raw Numbers and Demographics
Looking into fatal police shootings in the U.S. gives us important insights. A study by Johns Hopkins and Vanderbilt University found that 1,769 people got hurt each year from 2015 to 2020. Of these, 55% (979) died. The study looked at 10,308 police shooting incidents.
Annual Fatal Police Shooting Trends
The number of fatal police shootings has stayed about the same in recent years. In 2021, police killed 1,055 people, a bit more than the 1,021 in 2020. But, the racial breakdown of these deaths shows big disparities.
Racial Distribution of Police-Related Deaths
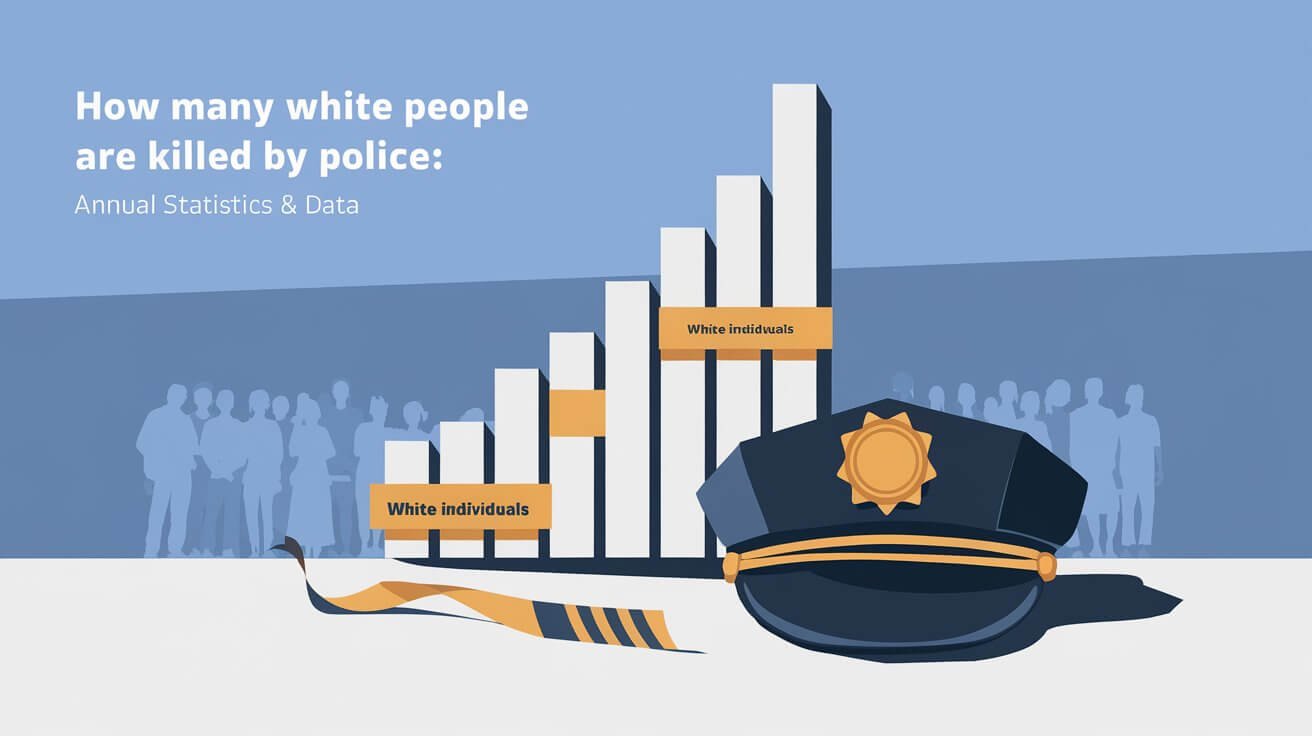
In 2021, white Americans were killed by police 482 times. Black Americans were killed 266 times, and Hispanic Americans 190 times. This is worrying because Black Americans are only 13% of the U.S. population. Yet, they are 2.9 times more likely than white Americans to be killed by police.
Population Proportion Analysis
The impact of fatal police shootings on Black Americans is clear. While white people are the majority of those killed, Black Americans are killed at more than double the rate. This shows big racial disparities in how police use force.
Historical Context of Police Use of Force
The history of policing in the U.S. starts with the “Slave Patrol” in the early 1700s in the Carolinas. These patrols aimed to control slaves, catch runaways, and use force to keep slaves in line. This legacy has shaped police mentality and practices, leading to ongoing law enforcement accountability and systemic racism in policing.
In 1868, the 14th Amendment gave equal rights to African Americans, ending Black Codes. Yet, the Slave Patrol mentality continued to influence law enforcement. Today, the U.S. faces a large prison population, with 655 people in prison per 100,000. This costs taxpayers $81 billion a year.
By 2015, young Black men were nine times more likely to be killed by police than others. Black people are almost five times more likely than White people to suffer police injuries. These numbers show the ongoing systemic racism in policing rooted in the Slave Patrol system.
| Time Period | Police Killings in Chicago | Percentage of Black Victims |
|---|---|---|
| 1870s to 1920s | 307 | 21% |
| 1875 to 1900 | 49 | N/A |
| 1900 to 1910 | 65 | N/A |
| 1910 to 1920 | 153 | 3% |
The table shows how police killings in Chicago grew over time, hitting the Black community hard. These numbers show the lasting systemic racism in policing that has shaped history.
How Many White People Are Killed By Police
The exact number of white victims of police violence changes each year. Yet, it’s clear that white people are killed by police at a rate that’s not in line with their population size. They make up about 41% of fatal police shootings, even though they are over 60% of the population. This shows a big impact on minority groups, like Black and Latino people.
Statistical Breakdown by Year
Looking closer at the numbers, we see white deaths by police have gone up in recent years. This is even as police use of force has stayed the same or gone up. From 2013 to 2017, there were about 11,456 police encounters that ended in death in the U.S.
Geographic Distribution
It’s also interesting to look at where white victims of police violence are found. Things like local police practices, community makeup, and economic conditions play a big role. These factors can change how often these incidents happen in different places.
Circumstantial Factors
When we look at the situations around these incidents, many factors come into play. Things like mental health issues, how much of a threat someone seems, and how officers react can all affect if someone dies. Knowing these details is key to making better policies and training to stop these tragedies in the future.
Comparing Fatal and Non-Fatal Police Shootings
When we talk about police actions, we often focus on fatal shootings. But non-fatal incidents are just as important. A study by Johns Hopkins University looked at 10,308 police shootings from 2015 to 2020. It found that 55% of these incidents were fatal.
Non-fatal shootings, though less talked about, are key to understanding police interactions. The study showed that non-Hispanic Black people were more likely to be in non-fatal shootings. This highlights the need for detailed data on all police actions.
Looking at these trends, we can help make police actions fairer. Policymakers and law enforcement can use this information to improve how they handle situations.
| Incident Type | Percentage |
|---|---|
| Fatal Shootings | 55% |
| Non-Fatal Shootings | 45% |
The study shows a detailed view of police interactions. Non-fatal shootings are important in understanding police actions. It’s vital to look at both fatal and non-fatal incidents to improve police actions and outcomes for everyone.
Armed vs Unarmed Victim Statistics
Police responses to armed suspects and unarmed victims of police shootings show a complex picture. A study by Johns Hopkins University looked at data from 2015 to 2019. It involved 3,090 Black and White males who were fatally shot by police.
Weapon Type Analysis
The study found that 84% of fatal police shootings involved victims with a firearm or other weapon. In 57% of these cases, someone else was also armed. But, 9% of the shootings were against unarmed people.
Threat Assessment Patterns
The data analysis revealed interesting insights. For example, the risk of being armed versus unarmed was smaller for Black males over 54 and those with mental illness. In the South, the risk was also smaller for Black males. But in the Midwest, it was higher.
This study points out complex social and environmental factors behind racial disparities in police shootings. More research is needed to fully understand these issues.
Mental Health Incidents and Police Response
Mental health is key in police interactions. Studies show many police shootings involve people with mental health issues. A Johns Hopkins study found 23% of police shootings were with such individuals. Sadly, 67% of these cases ended in death.
There’s a big need for better police training in mental health. Crisis Intervention Team (CIT) programs help officers handle mental health calls. But, by 2019, only 15 to 17% of police agencies had these programs. The training was often not required.
Models like the CAHOOTS program in Eugene, Oregon, show the value of mental health teams. In 2019, CAHOOTS handled over 24,000 calls. Only 311 needed police backup, proving the worth of dedicated crisis teams.
It’s vital to address mental health in police interactions to lower fatalities. Investing in crisis training and exploring new models can make everyone safer. This includes the public and the police.
Dispatch Call Outcomes and Mortality Rates
Recent studies have shown a key link between police dispatch calls and their outcomes. They found that calls leading to police responses were 46% more likely to end in fatal shootings. This is compared to incidents where an officer was already on the scene. This highlights the need for better training and new ways to handle certain emergency calls, like those involving mental health crises.
Emergency Response Analysis
An analysis of emergency response data is quite concerning. Wellness checks were found to be 74% more likely to result in fatal injuries than responses to incidents where shots had already been fired. This shows the big challenges and risks in these calls, which often involve people in mental health crises or other vulnerabilities.
Wellness Check Statistics
- Wellness checks were 74% more likely to result in fatal injuries than responses to incidents where shots had already been fired.
- The risk of individuals with untreated serious mental illness being killed while approached or stopped by law enforcement in the community is 16 times higher than for other civilians.
- At least 1 in 4 fatal law enforcement encounters involves an individual with serious mental illness, according to conservative estimates.
These findings show we need better training and new ways to handle certain calls. This is to keep both law enforcement and the community safe, and to help those in mental health crises. By tackling the unique challenges of these calls, we can aim to lower the tragic outcomes of police dispatch outcomes and wellness check fatalities.
Data Collection Challenges and Limitations
Tracking police use of force incidents in the U.S. is tough due to data collection issues. Current systems rely on police to report voluntarily. This leads to data that’s not always accurate or unbiased.
There’s no standard way for police to report these incidents. They don’t have to give detailed info to federal databases like the FBI’s Uniform Crime Reporting program. This means we don’t get a full picture of these events.
Media reports and public databases are also used, but they can be biased. Cases that get a lot of media attention are often overreported. Cases that don’t get much attention might not be recorded at all. This makes it hard to understand the real situation with police shooting data accuracy and reporting biases.
Death certificates also don’t always include important details about police involvement. This makes it even harder to collect accurate data. Without good data, it’s tough for researchers and policymakers to make smart decisions.
We really need better, mandatory reporting systems. These systems should track police shooting data accuracy and reporting biases well. Without reliable data, it’s hard to know the true extent of police use of force. This makes it hard to push for accountability and make real changes.
Civil Claims and Financial Impact
The financial costs of police misconduct settlements are huge. They put a big strain on taxpayers all over the U.S. In New York City, the city paid $175.9 million in 2019 for police lawsuits. Chicago paid out $500 million from 2004 to 2014 for similar reasons.
These numbers show we need big changes to stop police brutality. If we can lower these costs, taxpayers will save money. Communities can then use that money for better things, like safety and well-being.
Settlement Statistics
Recent data shows U.S. cities and counties pay over $3 billion a year for police misconduct settlements. These payments cover many issues, like too much force, wrong arrests, and civil rights breaks.
Taxpayer Cost Analysis
The cost of police brutality costs to taxpayers is very high. A study by the Brennan Center for Justice found costs range from $60 to $300 million a year per city. These costs take away from important services like schools, roads, and social programs. This hurts local communities a lot.
Police Training and De-escalation Protocols
High rates of fatal police shootings, often in mental health cases, have led to calls for better training. Experts suggest improving social services and using non-police units for calls. They also recommend diverting calls to mental health services and using police and mental health teams together. These steps aim to lower fatal encounters and improve police interactions with the public, a key part of law enforcement reform.
The Law Enforcement De-escalation Training Act of 2022 has set aside $34 million for a de-escalation curriculum. Another $90 million will help local police departments join these programs. Studies show that police de-escalation techniques can work well. For example, Camden saw a 40% drop in serious use-of-force incidents, and Tempe had a 58% cut in civilian injuries.
Yet, not all states require de-escalation training, and cost is a big issue. Critics say it might slow down police actions. But research shows it can improve safety and effectiveness in police interactions.


