How Many People Do Police Arrest A Year? Latest Figures
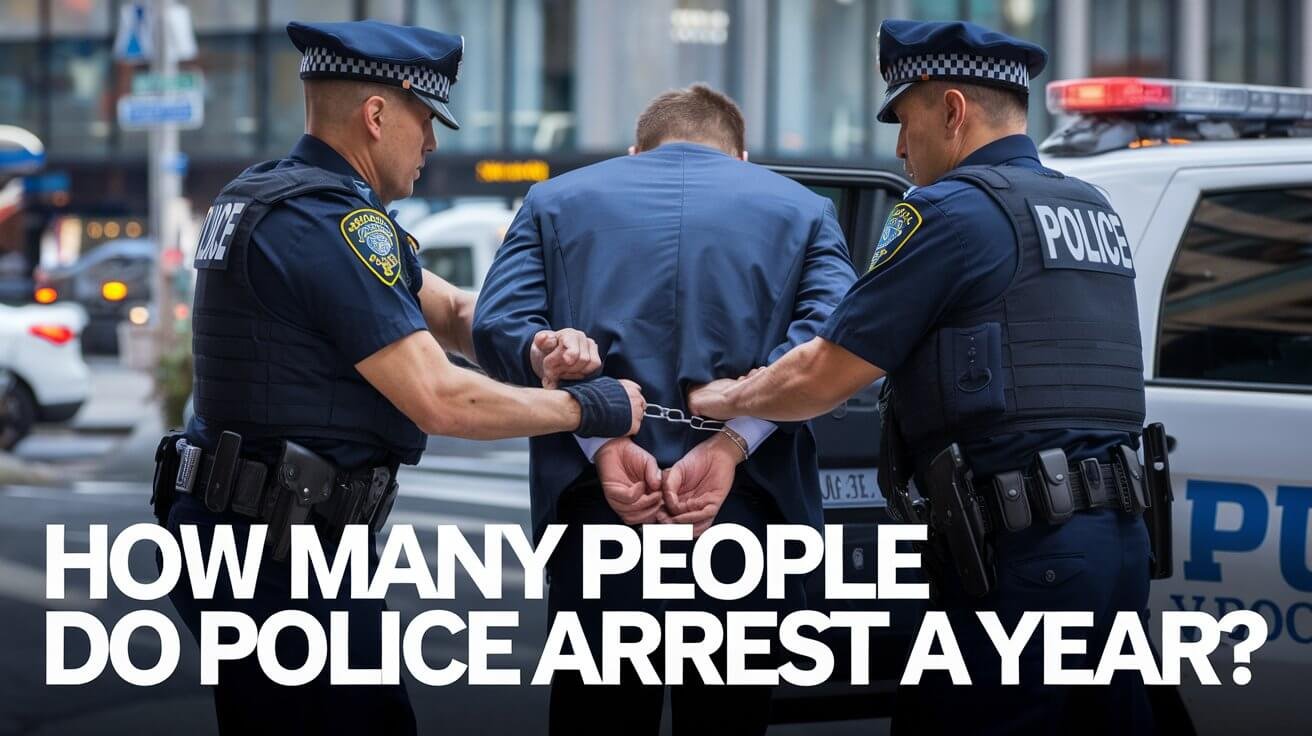
In the United States, police make over 10 million arrests yearly. This means an arrest happens every three seconds. It shows how important it is to look at arrest rates to understand law enforcement.
Most arrests, over 80 percent, are for minor crimes like disorderly conduct and drug use. It’s key to study these arrests to grasp the current situation. This helps us understand who gets arrested and why, shedding light on police work.
Current Annual Police Arrest Statistics in the United States
The United States has seen a drop in arrest rates, down 25% from 2006. Most arrests are for minor, non-serious crimes. The FBI reports a decrease in overall arrest rates.
Most arrests are for non-violent crimes like drug use and disorderly conduct. There are about 686,665 full-time police officers in the U.S. as of 2018. This shows a big effort to keep people safe and enforce laws.
Federal Arrest Numbers
Federal arrests are a small part of all arrests but deal with serious crimes. The federal government has started programs to cut crime and improve data collection.
State-Level Arrest Data
Arrest data varies by state. Some states have seen crime rates drop, while others have seen them rise. Knowing these trends helps in making better law enforcement plans.
Local Law Enforcement Arrest Figures
Local police are key in keeping communities safe. Their arrest numbers show what crimes are happening locally. This helps in planning to lower crime rates in communities.
Here is a summary of key statistics:
- 686,665 full-time employed law enforcement officials across the United States as of 2018
- 1,025 people shot and killed by police in the past year
- Only 35 non-federal law enforcement officers convicted of crimes related to fatal, on-duty shootings in the last 15 years
Demographic Patterns in Annual Police Arrests
Looking at who gets arrested, we see some groups are arrested more often. The Vera Institute of Justice found that most arrested are young, male, and from communities of color. This shows how policing affects these groups differently.
Racial disparities in policing are a big issue. Black drivers are stopped more than white drivers. Hispanic drivers are searched more than white drivers. The Stanford Open Policing Project has analyzed over 200 million records to show these differences. The UCR Arrests by Age, Sex, and Race data series also sheds light on who gets arrested.
Some important facts about who gets arrested include:
- Black drivers are stopped at higher rates than white drivers
- Hispanic drivers are searched more often than white drivers
- The majority of people arrested are young, male, and from communities of color
- Racial disparities in policing persist even after controlling for age and gender
It’s important to understand these patterns to make policing fairer. By looking at who gets arrested, we can work towards a more just system. The UCR program and other data sources help us see these patterns. They guide us in making policies that are fair and equal.
Most Common Types of Arrests Nationwide
Looking at crime types and arrest categories, we see some offenses are more common. The FBI’s Uniform Crime Report shows most arrests are for minor crimes. Over 80% of arrests are for things like disorderly conduct.
Drug-related arrests are a big part of all arrests, with most being for marijuana possession. In 2022, there were about 907,958 drug law violation arrests in the U.S. Here are some common arrest types:
- Drug abuse violations, leading to 1.5 million arrests each year
- Property crime arrests, like burglary and larceny
- Violent crime arrests, such as homicide and assault, making up less than 5% of all arrests
Understanding these crime types and arrest categories helps us see the nature of crime and law enforcement in the U.S. By looking at the data and trends, we can learn more about the criminal justice system. This helps us find ways to improve it.
Geographic Distribution of Police Arrests
The way police arrests spread out in the United States is complex. It’s shaped by things like how many people live in an area, if it’s a city, and the economic status of the community. The FBI says most arrests happen in big cities like New York and Los Angeles. This is shown in the FBI’s Uniform Crime Reporting (UCR) Program, which gathers and studies crime data from police all over the country.
Some important trends in where arrests happen include:
- Metropolitan areas make up 78% of all arrests, with cities outside these areas having the highest arrest rate (5,176 per 100,000 residents).
- The most common arrest category is “other non-traffic offenses,” making up over 30% of all arrests.
- Drug-related arrests are a big issue, with over 1.5 million happening every year, and a 171% increase from 1980 to 2016.
Understanding these trends is key for making law enforcement strategies work better. By looking at the data, police can plan where to focus their efforts. This helps reduce crime and make communities safer.
| City | Arrest Rate per 100,000 Residents |
|---|---|
| New York | 4,521 |
| Los Angeles | 4,341 |
| Chicago | 4,161 |
Seasonal Variations in Arrest Rates
Arrest rates in the United States change with the seasons. The FBI reports that more arrests happen in summer and fewer in winter. Weather, holidays, and social events play a role in these changes.
Holidays like New Year’s Eve and Halloween lead to more arrests. This is often for things like disorderly conduct and driving under the influence. Knowing these trends helps police plan better and tackle crime more effectively.
Summer vs. Winter Arrest Patterns
Summer and winter have different arrest rates. Summer sees more arrests for violent crimes like homicide and aggravated assault. Winter, on the other hand, has fewer arrests for these crimes. Here’s a table showing the differences:
| Crime Type | Summer Arrest Rate | Winter Arrest Rate |
|---|---|---|
| Homicide | 10.2 per 100,000 | 8.5 per 100,000 |
| Aggravated Assault | 120.1 per 100,000 | 100.5 per 100,000 |
| Disorderly Conduct | 50.8 per 100,000 | 40.2 per 100,000 |
Holiday Period Statistics
Holidays like New Year’s Eve and Halloween lead to more arrests. This is often for disorderly conduct and driving under the influence. Police have special plans for these times to handle the crowds and extra activity.
How Many People Do Police Arrest a Year: Historical Trends
Police arrest rates have been falling over time. The Vera Institute of Justice reports a 25% drop in arrests nationwide from 2006 to now. This change is due to new policing methods and shifts in how society views crime.
There’s been a drop in arrests for minor crimes. Yet, serious crimes like murder and assault have gone up. In 2020, the murder rate jumped by nearly 30%, with most murders being gun-related.
Arrest rates differ by age. In 2020, 40% of murder arrests were of people aged 20-29. Also, 2020 saw a record low in property crimes, except for motor vehicle thefts. Knowing these trends helps police make better strategies to fight crime.
Some key trends in arrest rates include:
- A decline in overall arrest rates from 2006
- An increase in murder and assault rates in recent years
- Variation in arrest rates by age group
- A record low in property crime rates in 2020
Looking at these trends, police can find ways to improve. They can use data on arrests, crime types, and demographics to shape their strategies. This helps in reducing crime and keeping communities safer.
First-Time Arrests vs. Repeat Offenders
Looking at first-time arrests and repeat offenders shows a big difference. Most people arrested are repeat offenders. The highest recidivism rates are among those with violent crime convictions.
Most first-time offenders are young. The highest recidivism rates are among those under 25. This shows we need to focus on helping young offenders.
Age Distribution Analysis
Young adults are more likely to be first-time offenders. But, they also have higher recidivism rates. It’s key to tackle the causes of crime in this age group.
Recidivism Patterns
Studies found many factors that lead to recidivism. These include prior convictions, substance abuse, and job instability. For example, nearly 25% of burglary arrestees commit another felony within 60 days. This is a big jump from 2017.
Understanding these patterns helps us develop better strategies. It supports first-time offenders in becoming productive citizens. Law enforcement and social services can work together to make communities safer.
Rural vs. Urban Arrest Statistics
Arrest statistics show big differences between rural and urban areas. The FBI reports most arrests happen in big cities like New York and Los Angeles. Rural areas have fewer arrests, mostly for property crimes like burglary and theft.
Some key stats show the gap between rural and urban arrests. For example, urban areas saw 24.5 violent victimizations per 1,000 people in 2021. Rural areas saw 11.1 per 1,000. Property crime rates were also higher in cities, at 157.5 per 1,000, compared to 57.7 in rural areas. This means cities face more crime, leading to more arrests.
Here are some key statistics comparing rural and urban arrests:
- Violent victimization rate: 24.5 per 1,000 people in urban areas, 11.1 per 1,000 people in rural areas
- Property victimization rate: 157.5 per 1,000 people in urban areas, 57.7 per 1,000 people in rural areas
- Arrest rates: higher in urban areas, with cities such as New York and Los Angeles having the highest arrest rates
Differences in arrest rates between rural and urban areas are clear. Cities face more crime and arrests. Knowing these differences helps law enforcement tailor their strategies to meet the needs of both rural and urban communities.
| Area | Violent Victimization Rate | Property Victimization Rate |
|---|---|---|
| Urban | 24.5 per 1,000 people | 157.5 per 1,000 people |
| Rural | 11.1 per 1,000 people | 57.7 per 1,000 people |
Police Department Size and Arrest Numbers
The size of a police department affects how many arrests are made. The FBI says big police departments, like those in New York and Los Angeles, arrest the most people. Smaller departments in towns often arrest fewer, mostly for property crimes.
Looking closer, we see that a police department’s size really matters. For example, the Memphis Police Department grew by over 390 officers. This change helped lower gun crimes thanks to a new Gun Crimes Unit.
| Police Department | Arrest Numbers | Police Department Size |
|---|---|---|
| Memphis Police Department | High | Large |
| New York Police Department | High | Large |
| Los Angeles Police Department | High | Large |
| Small Town Departments | Low | Small |
Bigger police departments arrest more people. Knowing this helps police use their resources better to fight crime.
Technology Impact on Arrest Rates
Technology has changed how police work, affecting arrest rates. The FBI says body cameras and other tech have lowered arrests. This is because these tools make police more accountable and open, helping to avoid unnecessary arrests and improve relations with the community.
Some key statistics show how technology has changed arrest rates:
- 47% of general-purpose law enforcement agencies had acquired body-worn cameras in the U.S. in 2016.
- 86% of law enforcement agencies that acquired body-worn cameras had a formal policy for their use.
- 80% of local police and sheriffs’ offices acquired body-worn cameras to improve officer safety, evidence quality, reduce civilian complaints, and agency liability.
Facial recognition technology is also growing, with 42 federal agencies using it. But its effect on arrests is not yet clear. Many people worry that it could lead to more false arrests if used widely.
| Technology | Percentage of Agencies Using | Purpose |
|---|---|---|
| Body-worn cameras | 47% | Improve officer safety, evidence quality, reduce civilian complaints |
| Facial recognition technology | 42% (federal agencies) | Identify suspects, track missing persons |
Effect of technology on arrest rates is complex. New tools can help, but they also raise concerns. It’s important for police to use these technologies wisely and openly.
Police Reform Effects on Arrest Statistics
Police reform has led to fewer arrests, mainly for minor crimes. The Vera Institute of Justice says this is because of more focus on community policing and de-escalation. These methods help lower unnecessary arrests and improve relations with the community.
Some key changes in arrest numbers because of police reform include:
- Less arrests for minor, non-serious crimes
- Lower arrest rate differences among racial groups
- More use of citations and warnings instead of arrests
In 2016, over 80% of arrests were for minor, nonviolent crimes. Police reform tries to change this by focusing on community policing and de-escalation. This approach aims to cut down on arrests and strengthen police-community ties, leading to a fairer society.
| Year | Number of Arrests | Percentage of Nonserious Nonviolent Charges |
|---|---|---|
| 2016 | 10.5 million | 80% |
Closing Thoughts
The topic of police arrests in the United States is complex. Many factors affect the arrest statistics we see. Even though the arrest rate has dropped by 25% from 2006, most arrests are for minor crimes.
This shows we need a smarter way to keep people safe. We should focus on helping people change their ways, not just punishing them.
Arrests hit hard on people with disabilities and minority groups. This makes it clear we need to change how police work. We must work on building better relationships between police and communities.
Training officers well and teaching them to avoid violence is key. This helps make the justice system fairer and more effective.
As we look ahead, it’s vital for everyone to work together. Policymakers, police, and community leaders must share arrest data. They should study it and use what they learn to make things better.
Working together, we can create a safer future. One where everyone is treated fairly, no matter who they are or where they come from.
Reader Questions
How many people do police arrest a year?
In the United States, over 10 million people are arrested each year. This is a high number.
What are the current annual police arrest statistics in the United States?
The arrest rate in the U.S. has gone down by 10% from 2006. Most arrests are for minor crimes like drug use and disorderly conduct.
What are the demographic patterns associated with annual police arrests?
Most arrested are young, male, and from communities of color. This is a common pattern.
What are the most common types of arrests made nationwide?
Most arrests are for minor crimes like drug use and disorderly conduct. Drug arrests, mostly for marijuana, are very common. Property crimes like burglary and larceny also happen a lot. But violent crimes like homicide and assault are rare.
How is the geographic distribution of police arrests?
Most arrests happen in big cities. Places like New York and Los Angeles have the highest rates.
Are there any seasonal variations in arrest rates?
Arrest rates go up in summer and down in winter. Holidays like New Year’s Eve and Halloween see more arrests, often for minor crimes.
What are the historical trends in police arrests?
The arrest rate has dropped by 25% from 2006. Most arrests are for minor crimes.
What are the differences between first-time arrests and repeat offenders?
Most arrested are repeat offenders. Those with violent crime convictions have the highest recidivism rates. Young people, under 25, are more likely to be first-time offenders and have higher recidivism rates.
How do rural and urban arrest statistics differ?
Big cities have more arrests, with New York and Los Angeles leading. Rural areas have fewer arrests, mostly for property crimes like burglary and larceny.
How does police department size relate to arrest numbers?
Big police departments make more arrests, with New York and Los Angeles leading. Small towns have fewer arrests, mostly for property crimes.
How has technology impacted arrest rates?
Technology, like body cameras, has lowered arrest numbers. It makes police more accountable and improves relations with the community.
How have police reform efforts affected arrest statistics?
Police reform has cut down on arrests, mainly for minor crimes. It focuses on community policing and de-escalation, improving relations and reducing unnecessary arrests.

